Sunday, June 30, 2013

S&P 500 - Triple Screen 'Technical Analysis' - Week: 24 June to 28 June: 2013 - Bulls Pullback


S&P 500 - End of  Month Chart (EOM) - Channel analyzing Data from mid 2009, onward - as on 28 June'13


S&P 500 - End of  Week Chart (EOW) - Channel analyzing Data from Aug' 2011 onward - as on 28 June'13


S&P 500 - End of  Day Chart (EOD) -  Channel analyzing Data from Nov'2012, onward - as on 28 June'13


Learning from the Past Week:  (click here for the post)


Patterns:
  • Three inside down on the Weekly chart #W1 - studied earlier - takes a break even as the Bulls make some green.
  • Bearish Harami on the Long Term Charts  #M1.

Support & Resistance:
  • Bulls bring up the index to the channel bottom #D1 - and get stopped in their pull back attempt.

Moving Averages:
  • 5 EMA touching the 13 SMA on the Medium term charts #W1  & the Day Screen #D1.
  • June closes above the 5 EMA  #M1.
  • Bulls miss a close above the 13 SMA on the Week Charts #W1 - by a whisker.

Indicators:
  • RSI and its MA remain below oversold #W2.
  • Oscillator stays below the 50 mark #D2.


Bulls 'Pull back' to our identified resistance - Day Channel's Bottom Green Line #D1..and stop..


Looking forward into the next Week:


Patterns:

Support & Resistance:
  • Day channel's, bottom green line #D1 remains the resistance for the Bulls.
  • The 76.4% Fibonacci Retrace - remaining around the last consolidation cluster #M1, is good for Bears.

Moving Averages:
  • Closing above the 5 EMA on the EOM #M1 - shows long term strength of the Bulls.
  • 5 EMA & 13 SMA  #W1  - Deflection is good for Bulls and Cross helps Bear Cause.
  • 5 EMA & 13 SMA  #D1  - Deflection is good for Bears and Cross helps Bull Cause.

Indicators:
  • Oscillator staying sub 50 despite the up move is good for bears #D2.


Bears eye the potential 3 inside down #M1, Bulls call for a deflection of the 5 EMA and 13 SMA #W1.


CNX Nifty 50 - Triple Screen 'Technical Analysis' - Week: 24 June to 28 June: 2013 - Bulls find support


Nifty 50 - End of Month (EOM) Chart - Channel analyzing Data from 2008 onward - as on 28 June'13


Nifty 50 - End of  Week (EOW) Chart - Channel analyzing Data from Mid 2011 onward - as on 28 June'13


Nifty 50 - End of  Day  (EOD) Chart - Channel analyzing Data from Nov' 2012, onward - as on 28 June'13


Learning from the Past Week: (click here for the post)


Patterns:

Support & Resistance:
  • Day Channel perfectly catches the Bears and sends the Bulls to the channel top #5.
  • The 61.8% Fibonacci retrace of the 'Jan'12 low to All time high' was support zone #5.
  • Week Channel's Middle Blue line was resistance last week #3.

Moving Averages:
  • 5 EMA and 13 SMA touch #5.
  • 200 SMA on the Day Charts retaken by Bulls #5.
  • 13 SMA on the Medium Term - was also resistance last week #3.

Indicators:
  • We use the 'Trend Deviation' Indicator #2 on the long term charts from now..
  • Volumes are High for the up move #6.
  • MACD and its MA converge #6.


Bulls find the support to flip the Nifty from Day channel bottom to channel top #5 in a couple of days..


Looking Forward into the next Week:


Patterns:

Support & Resistance:
  • Day Channel top is now resistance to beat for the Bulls #5.
  • The 61.8% Fibonacci retrace of the 'Jan'12 low to All time high' is support zone for Bears #5.

Moving Averages:
  • 5 EMA and 13 SMA touch for a Bullish Cross or Bearish Deflection #5.
  • Keeping above the 200 SMA on the Day Charts good for Bulls #5.
  • 13 SMA on the Medium Term - is resistance #3.
  • 50 SMA and 200 SMA, convergence towards a death cross to be watched #5.

Indicators:
  • 'Trend Deviation' Indicator #2 is in Bull zone for June..
  • Volumes remaining High for the up move, good for Bulls #6.
  • MACD and its MA poised for a Cross or Deflection from the '-50' zone #6.


Bears now eye the combined effect of the Shooting Star and Hanging Man  #1 - Bulls look forward to the potential Three Outside Up #3

Saturday, June 29, 2013

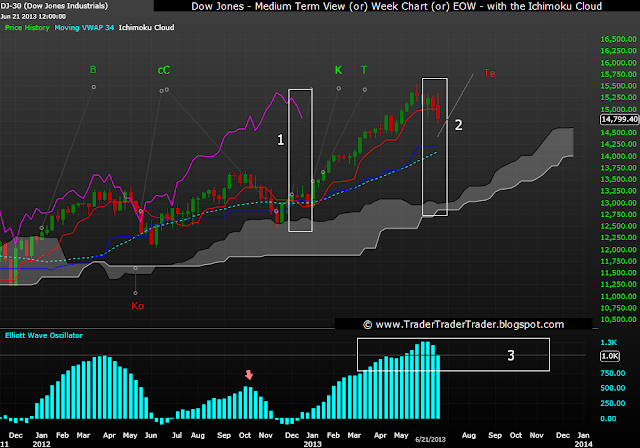
The Dow Jones - Ichimoku Study - Week: 24 June to 28 June: 2013 - Bears Hold Gains


                             .....Regulars can skip below and go straight to the chart......

Introduction can be read at this link (click). 


Quick Reference : 
Chikou Span - pink line,
Kijun Sen - blue line, 
Senkou Span A - black line, 
Senkou Span B - grey line, 
Kumo - grey shaded area,
Tenkan Sen - red line.


Recent Signals seen on DJI 30 - Week Chart (EOW) marked on chart as per notes below

The Chikou Span Cross:  Strong Bullish Signal (cC)  
The Kijun sen cross:  Strong Bullish Signal (K) 
The Tenkan Sen/Kijun Sen Cross:  Strong Bullish Signal (T)


Last:
Tenkan Sen Cross:  Weak Bearish Signal (Te)


Dow 30 - End of  Week Chart (EOW) - Using 12 months Span - as on 28 June'13


Learning from the Past Week: (click here for that post)


Bears keep it below the Tenkan Sen ..  #2..
The Oscillator #3 ticks down.
Bulls bring back some Green - however fail to retake the Tenkan Sen #2.


Bears stay in ...


Looking Forward into the next Week:

Bears need to continue to hold the index below the Tenkan Sen #2.
Chikou Span getting closer to the Price line to be watched #1.
Bulls would look at getting back the advantage - rising above the Tenkan Sen #2.


Bears eye the distant Kijun Sen #2 .... Bulls remain under pressure.


BSE Sensex - Ichimoku Study - Week: 24 June to 28 June: 2013 - Bullish Cross Bingo!


                     .....Regulars can skip below and go straight to the chart......


Introduction / Preamble can be read at this link (click). 

Quick Reference : 

Chikou Span - pink line,
Kijun Sen - blue line, 
Senkou Span A - black line, 
Senkou Span B - grey line, 
Kumo - grey shaded area,
Tenkan Sen - red line.


Recent Signals seen on BSE 30 - Week Chart (EOW) marked on chart as per notes below:

The Chikou Span Cross:  Weak Bearish Signal (Cc)  
The Tenkan Sen Cross:  Bearish Signal (Te)
The Tenkan Sen/Kijun Sen Cross:  Strong Bullish Signal (T)

New:
The Kijun Sen Cross: Strong Bullish Signal (K)


BSE 30 - End of  Week Chart (EOW) - Using 12 months Span - as on 28 June'13


Learning from the Past Week: (click here for the post)


After the long awaited Bullish 
Tenkan Sen & Kijun Sen Cross, of the week before last - Bulls see Green last week #2.
Price bounces off the Kumo #2.
Index pops big time to reach the Tenkan Sen  #2.
Chikou Span remains just below the price line #1.
Oscillator ticks down  #3.


Bullish Cross of the Tenkan Sen & Kijun Sen produces a Engulfing Green Week #2.


Looking Forward into the next Week:


Tenkan Sen is the resistance now #2.
A Bearish Tenkan Sen - Kijun Sen Cross now, may give the Bears a sneaky win #2.
Chikou Span action vis-a-vis the price line is of critical importance #1.
With the Tenkan Sen staying above the Kijun Sen, Bulls can aim for new highs #2..  

Chikou Span and Tenkan Sen, are the action points for the Bulls next week ...


Sunday, June 23, 2013

S&P 500 - Triple Screen 'Technical Analysis' - Week: 17 June to 21 June: 2013 - Bears Break Channel.


S&P 500 - End of  Month Chart (EOM) - Channel analyzing Data from mid 2009, onward - as on 17 May'13


S&P 500 - End of  Week Chart (EOW) - Channel analyzing Data from Aug' 2011 onward - as on 17 May'13


S&P 500 - End of  Day Chart (EOD) -  Channel analyzing Data from Nov'2012, onward - as on 17 May'13


Learning from the Past Week:  (click here for the post)

Three inside down on the Weekly chart #3 - studied earlier - continued to bring the index down.
Bears get back the Short Term cracking the Channel bottom #D1.
5 EMA stays below the 13 SMA #D1.
RSI and its MA remain below oversold #W2.
The 76.4% Fibonacci Retrace - remains at the last consolidation cluster #M1.
On the Short term charts 5 EMA moves above then goes below the 13 SMA last week #D1.
EOM charts see the Bulls taking support on the 5 EMA #M1 for the second week.
On the Week chart - 5 EMA close to sliding below the 13 SMA next week #W1.


Bears break our identified support - Day Channel's Bottom Green Line #D1..


The Ellipses marked #M1, #W1 and #D1 indicate the hot spots on the long, medium and short term charts respectively.
As one can see - we are zooming into the action starting #M1 through #W1 and get up close in #D1.


Looking forward into the next Week:

Day channel's, bottom green line #D1 is now the resistance for the Bulls.
5 EMA on the EOM #M1 - is the next available support for Bulls.
Bulls yet to clear off the Triple Top Threat conclusively ...
Moving the price, above the 13 SMA on the EOW #3, next task for bulls.
The 76.4% Fibonacci Retrace - remaining around the last consolidation cluster #M1, is good for Bears.
5 EMA crossing above or deflecting off the 13 SMA to be watched #D1.
Three inside down on the Weekly chart #3 - studied earlier - continues to be in play.


Bear hope remain on the 3 inside down #W1, Bulls hope for a deflection of the 5 EMA and 13 SMA #W1.


CNX Nifty 50 - Triple Screen 'Technical Analysis' - Week: 17 June to 21 June: 2013 - Bears Roll on..


Nifty 50 - End of Month (EOM) Chart - Channel analyzing Data from 2008 onward - as on 17 May'13


Nifty 50 - End of  Week (EOW) Chart - Channel analyzing Data from Mid 2011 onward - as on 17 May'13


Nifty 50 - End of  Day  (EOD) Chart - Channel analyzing Data from Nov' 2012, onward - as on 17 May'13


Learning from the Past Week: (click here for the post)


Last month's Shooting star candlestick #1- gives the Bears their 3rd Red week in June - Index ends the week at the 61.8% Fibonacci retrace of the Jan'12 low to All time high #5. 
Support line on the STS #4, fails the Bulls.
Volume ticks up, for this down move #7.
The short fuse indicator, which  started June at zero, continues to moves lower #2.
Bearish Deflection of the  5 EMA and 13 SMA, gives the bears momentum #6.
Bearish Cross of the 5 EMA and 13 SMA, on the Medium Term (@5737) also adds speed to the fall #3.


Bears move the Nifty down to the '61.8% Fibonacci retrace of the Jan'12 low to All time high' #5. 


Looking Forward into the next Week:


Bullish Cross of the 5 EMA and 13 SMA, in the short term to be watched for #5.
Bulls look to keep above the 61.8% Fibonacci retrace of the Jan'12 low to All time high #5. 
50 SMA and 200 SMA, convergence towards a death cross to be watched #5.
Shooting Star Candle stick #1 studied early this month, is still in play.
Bears take control the Medium Term and the Short Term Screens now.


Bear hope remain on the Shooting Star #1 - Bulls see support at the "61.8% Fibonacci retrace of the Jan'12 low to All time high" #5


The Dow Jones - Ichimoku Study - Week: 17 June to 21 June: 2013 - Bears Nose in


                             .....Regulars can skip below and go straight to the chart......

Introduction can be read at this link (click). 


Quick Reference : 
Chikou Span - pink line,
Kijun Sen - blue line, 
Senkou Span A - black line, 
Senkou Span B - grey line, 
Kumo - grey shaded area,
Tenkan Sen - red line.


Previous Signals seen on DJI 30 - Week Chart (EOW) marked on chart as per notes below

The Kumo Breakout: Strong Bullish  Signal (B)
The Flat Kumo: Bearish Signal (Ko)
The Chikou Span Cross:  Strong Bullish Signal (cC)  
The Kijun sen cross:  Strong Bullish Signal (K) 
The Tenkan Sen/Kijun Sen Cross:  Strong Bullish Signal (T)


Last:
Tenkan Sen Cross:  Weak Bearish Signal (Te)


Dow 30 - End of  Week Chart (EOW) - Analyzing 12 months Data - as on 21 May'13


Learning from the Past Week: (click here for that post)


Bears Crash below the Tenkan Sen ..  #2..
The Oscillator #3 ticks down.
Bulls close celebrations with 26 weeks spent above the Tenkan Sen #2 after bouncing of the Kumo #1.


Bears edge in ...


Looking Forward into the next Week:

Bears need to hold the index below the Tenkan Sen #2.
Oscillator remaining below the High line, important for Bears #3.
Bulls would look at getting back the advantage - rising above the Tenkan Sen #2.


Bears eye the distant Kijun Sen #2 .... Bulls remain under pressure.


BSE Sensex - Ichimoku Study - Week: 17 June to 21 June: 2013 - Meeting for Deflection or Cross 6 - Surprise !


                     .....Regulars can skip below and go straight to the chart......


Introduction / Preamble can be read at this link (click). 

Quick Reference : 

Chikou Span - pink line,
Kijun Sen - blue line, 
Senkou Span A - black line, 
Senkou Span B - grey line, 
Kumo - grey shaded area,
Tenkan Sen - red line.


Previous Signals seen on BSE 30 - Week Chart (EOW) marked on chart as per notes below:

The Senoku Span Cross:  Neutral Bullish Signal (Ss)
The Kumo Break-out: Bullish Signal (B)  
The Flat Kumo: Bearish Signal (Ko)
The Chikou Span Cross:  Weak Bearish Signal (Cc)  
The Tenkan Sen Cross:  Bearish Signal (Te)
The Kijun Sen Cross: Weak Bearish Signal (K) 

New:
The Tenkan Sen/Kijun Sen Cross:  Strong Bullish Signal (T)


BSE 30 - End of  Week Chart (EOW) - Analyzing 12 months Data - as on 21 May'13


Learning from the Past Week: (click here for the post)


Tenkan Sen & Kijun Sen lines Cross Bullishly  #2. 
Chikou Span remains below the price line #1.
Index stays below the Kijun Sen, Tenkan Sen, MVWAP 34 confluence  #2.
Oscillator ticks down  #3.
Price takes support near the Kumo #2.


Tenkan Sen & Kijun Sen lines Cross Bullishly - exactly as studied in the last 6 weeks.


Looking Forward into the next Week:


A Bullish Tenkan Sen - Kijun Sen Cross, appeared last week - despite the index sliding lower #2.
A Bearish Tenkan Sen - Kijun Sen Cross now, may give the Bears a sneaky win #2.
Taking support near the Kumo, Bulls can attempt to get above the Kijun Sen, Tenkan Sen, MVWAP 34 confluence  #2.


Tenkan Sen did move above the Kijun Sen making a Bullish Cross - to the relief of the hopeful Bulls and the chagrin of the bemused Bears...


Sunday, June 16, 2013

S&P 500 - Triple Screen 'Technical Analysis' - Week: 10 June to 14 June: 2013 - Bulls Hold Channel Again..


S&P 500 - End of  Month Chart (EOM) - Channel analyzing Data from mid 2009, onward - as on 14 May'13


S&P 500 - End of  Week Chart (EOW) - Channel analyzing Data from Aug' 2011 onward - as on 14 May'13


S&P 500 - End of  Day Chart (EOD) -  Channel analyzing Data from Nov'2012, onward - as on 14 May'13


Learning from the Past Week:  (click here for the post)

Three inside down on the Weekly chart #3 - studied last week - continued to be in play.
Bulls hold the Short Term with a bounce off the green Day Channel Bottom #D1 once again.
5 EMA stays below the 13 SMA #D1.
RSI and its MA slip below oversold #W2.
The 76.4% Fibonacci Retrace - remains at the last consolidation cluster #M1.
Ultimate Oscillator #D2 hovers just above the mid point.
EOW& EOM charts see the Bulls taking support on the 13 SMA #W1 and the 5 EMA #M1 respectively for the second week.


Bears stopped again by our identified support - Day Channel's Bottom Green Line #D1..


The Ellipses marked #M1, #W1 and #D1 indicate the hot spots on the long, medium and short term charts respectively.
As one can see - we are zooming into the action starting #M1 through #W1 and get up close in #D1.


Looking forward into the next Week:

Day channel's, bottom green line #D1 is support and the latest 'All Time High' #M1 the resistance for the Bulls.
Bulls would still want to clear off the Triple Top Threat conclusively ...
Getting the price, above the 5 EMA on the EOW #3, critical for bulls to get ahead.
Breaking the Day Channel's Bottom Green Line #D1 is what the Bears would want to do next...
The 76.4% Fibonacci Retrace - remaining around the last consolidation cluster #M1, is good for Bears.
5 EMA crossing above or deflecting off the 13 SMA to be watched #D1.
Three inside down on the Weekly chart #3 - studied the week before last week - continues to be in play.


Bulls look at continuing the up move from the Day Channel bottom #D1 - Bear hope remain on the 3 inside down #W1, giving them a channel break.