Monday, March 30, 2015

S&P 500 - Triple Screen 'Technical Analysis' - Channel Support Gives - Week 1 of April 2015.


Learning from last Week:  (click here for the previous post)


Patterns:
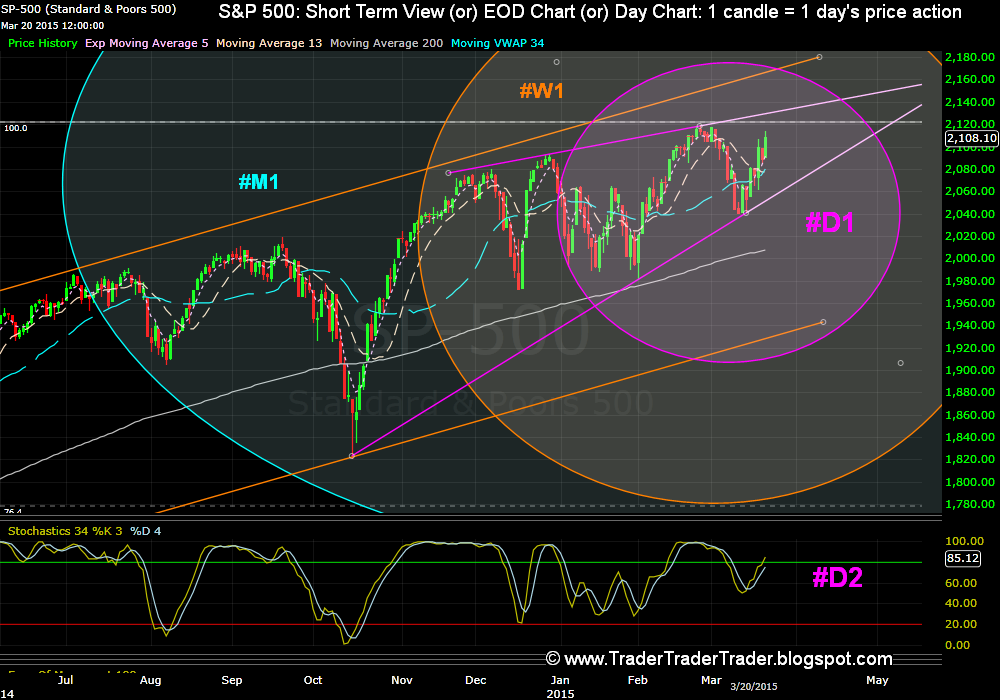
  • After bouncing from the Day channel's bottom - Bulls fail to make a higher high and slide right back, and is now below the channel's bottom line #D1.
  • This month's candle is forms a Bearish Harami, with the previous month's candle - as of now #M1. Last two candles on the EOW already form a Bearish Harami #W1.
Support & Resistance:
  • Index found resistance at the ATH, while support was at the 5 EMA on the EOM #M1.
Moving Averages:  
    • The all important, 5 EMA and 13 SMA, on the medium term screen, stay deflected Bullishly as of last week #D1.
    Indicators:
    • RSI 13 is still around the 50s #W2.

    Wrap:
    Index resisted near the ATH, takes support at the Long Term 5 EMA #M1.


    Looking forward into this Week:

    Patterns:
    • Bulls now need to deal with the Bearish Harami made by this month's candle, to prevent a Long Term Three inside down (Study Links herehere or elsewhere#M1. 
    • Bears need to close this week below last week's close, to produce a Medium Term Three inside down (Study Links herehere or elsewhere#M1
    • Bulls look to History (re-look) #M1 & #M3, and the support at the 5 EMA #M1, for a resumption of the Bull run.
    Support & Resistance: 
    • Day Channel's Bottom is the resistance that Bears want to keep below, while the Bulls seek to keep above the support at the 5 EMA on the EOM #M1.
    Moving Averages:
    • Above 2034, the 5 EMA and the 13 SMA on the Weekly  Charts, would stay deflected Bullishly #W1.
    Indicators:
    • TSI, if supported at the 61.8% Fibonacci retrace, would hold some cheer for the Bulls #M2.


    Wrap:
    Bears look to close this week below 2061 and trigger a Three Inside Down #M1.
    Bulls trust History #M1 & #M3 and aim to keep above the 5 EMA on the month chart. 


    The Dow Jones - Ichimoku Study - Thinning Kumo 4 - Week 1 of April 2015.


    Learning from the earlier Study: (click here for the post)

    Bears take index below the Tenkan Sen but fail to get a weekly close below that line last week #W2.
    Tenkan Sen and Kijun Sen, gap steady #W2.
    Senoku Span A & B, gap narrow and steady #W3.
    Thinning Kumo couple of weeks away #W2.


    Wrap: Bears fail to close index below Tenkan Sen #W2.


    Looking Forward into this Week:


    Bears eye the Thinning Kumo #W2 (Study Links herehere or elsewhere) for an opportunity to break into the Kumo.
    Bearish Cross of Tenkan Sen & Kijun Sen, at current range, next on Bear Agenda #W2.
    Chikou Span at current altitude, can meet up with the price line in a few weeks #W1.


    Wrap: Bulls look to stay above the Tenkan Sen and make new ATHs, Bears eye the Thinning Kumo to bring the Index down #W2. 


    CNX Nifty 50 - Triple Screen 'Technical Analysis' - Bear Up - Week 1 of April 2015.


    Learning from last Week: (click here for the previous post)


    Patterns:
    • The Evening Star formation we studied earlier, gives the Bears yet another red candle #W1- Index leaves behind the Long Term 5 EMA, giving the Bears an entry into the Medium and Long Term Screens #M1.
    • Bulls see their long term 'Three Outside Up' (last 4 candles) #M1. threatened by a potential Bearish engulfing (last 2 candles) #M1.
    Support & Resistance:
    • Bulls failed to hit the March Wall last week and came back from our support, the S2 of the March Pivot to end near the April Wall #M1.
    Moving Averages: 
    • The critical 5 EMA and 13 SMA on the EOW, has crossed bearishly last week #W1.
    Indicators:
    • STS stays below the over bought line #W2.


    Wrap:
    Bears after defending the Weekly Channel top and following it up with an 'Evening star' - make red weeks all the way to the S2, on the March Pivot #W1.
    Bulls manage a close near the April Wall (8343)


    Looking Forward into this Week:


    Patterns:
    • The Evening Star on the Medium Term Screen (Study Links herehere or elsewhere) is active #W1.
    • Long Term Charts, see the Three Outside Up (Study Links herehere or elsewhere) threatened by a possible Bearish Engulfing (last 2 candles)  #M1.
    Support & Resistance:
    • Index resistances that the Bulls would want to get above this week, are 8343 (Wall for April 2015 and 8919.
    • Support Levels that the Bears want to get below, are the revised day channel's bottom line #D1 and 200 SMA on the Day Charts).
    Moving Averages: 
    • Golden Cross (study herehere or elsewhere) of the 50 & 200 SMA is on - these MA's are currently converging #D1.
    • The critical 5 EMA and 13 SMA on the EOW, will stay crossed bearishly below 8919 #W1.
    Indicators:
    • Bulls hope to see the STS, moving back above the overbought line #W2.


    Wrap :
    Bulls look to slip above the Wall (8343) and then get back above the Long Term (Monthly) 5 EMA #M1.
    Bears look to the possible Long Term 'Bearish Engulfing' #M1, to stay put below the April Wall.


    BSE Sensex - Ichimoku Study - Life below the Kijun Sen - Week 1 of April 2015.


    Introduction / Primer to Ichimoku can be read at this link (click). 


    Learning from the Earlier Study: (click here for the post)


    Bears taste life below the Kijun Sen, after they break through this line after 18+ months #W2.

    Gap between the Senkou Span A & B  #W3, as also the Tenkan Sen & Kijun Sen narrows #W2.
    The Chikou span #W1 almost at price line


    Wrap: Index below the Kijun Sen after 18+ months #W2, Bulls see the Chikou Span above Price line
     #W1


    Looking Forward into this Week:


    Chikou Span holding above the Price Line, is some solace for Bulls #W1.

    Narrowing gap between the Senkou Span A & B  #W3, as also the Tenkan Sen & Kijun Sen, opens possibility of bullish deflection or bearish cross #W2.


    Wrap: Bulls pray that the Chikou Span bounces off the Price line #W1, helping the index get back above the Kijun Sen.

     Bears look to push towards the Kumo.


    Monday, March 23, 2015

    The Dow Jones - Ichimoku Study - Thinning Kumo 3 - Week 4 of March 2015.


    Learning from the earlier Study: (click here for the post)

    Bulls surge up after closing above the Tenkan Sen last week #W2.
    Tenkan Sen and Kijun Sen, gap steady #W2.
    Senoku Span A & B, gap narrow and steady #W3.
    Thinning Kumo couple of weeks away #W2.


    Wrap: Bulls surge after last week's stop above the Tenkan Sen #W2.


    Looking Forward into this Week:


    Bears eye the Thinning Kumo #W2 (Study Links herehere or elsewhere) for an opportunity to break into the Kumo.
    Bearish Cross of Tenkan Sen & Kijun Sen, at current range, next on Bear Agenda #W2.
    Chikou Span at current altitude, can meet up with the price line in a few weeks #W1.


    Wrap: Bulls look to stay above the Tenkan Sen and make new ATHs, Bears eye the Thinning Kumo #W2. 


    S&P 500 - Triple Screen 'Technical Analysis' - Channel Support Works - Week 4 of March 2015.


    Learning from last Week:  (click here for the previous post)


    Patterns:
    • After triggering a 3 Inside down, on the weekly charts, Bears drive down to the Day channel's bottom - Bulls manage a massive bounce from here #D1.
    • This month's candle is a Doji, which has gapped above the previous month as of now #M1.. 
    Support & Resistance:
    • Index moves above all the MAs that we track, resistance to beat is the ATH #M1.
    Moving Averages:  
      • The all important, 5 EMA and 13 SMA, on the medium term screen, deflects Bullishly last week #D1.
      Indicators:
      • RSI 13 is still in the 50s #W2.

      Wrap:
      Index bounces from support #D1, and heads close to the ATH #M1.


      Looking forward into this Week:

      Patterns:
      • Bears eye the Doji made by this month's candle - hoping for an Evening Star formation #M1.
      • Bulls look to History (re-look) #M1 & #M3, and the Day Channel's Bottom line #D1, for a resumption of the Bull run.
      Support & Resistance: 
      • 5 EMA on the Daily Charts #D1, is the support that Bears want to slip below, while the Bulls want to clear the ATH #M1.
      Moving Averages:
      • The 5 EMA and 13 SMA on the Week  Charts, would stay deflected  Bullishly above  2015 #W1.
      Indicators:
      • TSI, if resisted by the 76.4% Fibonacci retrace, would hold some cheer for the Bulls #M2.


      Wrap:
      Bears pray for an Evening Star and brace to hold the ATH #M1.
      Bulls trust History #M1 & #M3 and aim to clear the All time High (ATH). 


      CNX Nifty 50 - Triple Screen 'Technical Analysis' - Hi 5 - Week 4 of March 2015.


      Learning from last Week: (click here for the previous post)


      Patterns:
      • Previous week's Evening Star gives the Bears one more red candle #W1- Index says Hi to the Long Term 5 EMA with a touch and bounce #M1.
      • Bulls see their long term 'Three Outside Up' (last 4 candles) #M1. threatened by a potential Bearish engulfing (last 2 candles) #M1.
      Support & Resistance:
      • 5 EMA on the EOM (8555) #M1, was the exact support last week.
      • 5 EMA on the EOW (8777) #W1, was the clear resistance last week.
      Moving Averages: 
      • The critical 5 EMA and 13 SMA on the EOW, poised to cross bearishly or deflect bullishly #W1.
      Indicators:
      • STS slips below the over bought line #W2.


      Wrap:
      Bears after defending the Weekly Channel top and following it up with an 'Evening star' - make a red week and close below the wall #W1.
      Bulls take support on the Long Term 5 EMA #M1.


      Looking Forward into this Week:


      Patterns:
      • Previous week's Evening Star on the Medium Term Screen (Study Links herehere or elsewhere) is active #W1.
      • Long Term Charts, see the Three Outside Up (Study Links herehere or elsewhere) threatened by a possible Bearish Engulfing (last 2 candles) #M1.
      Support & Resistance:
      • Index resistances that the Bulls would want to get above this week, are 8684 (Wall for March 2015 and 8618.
      • Support Levels that the Bears want to get below, are S2 on the March Pivot #M1 and 8555 (5 EMA on the Monthly Charts).
      Moving Averages: 
      • Golden Cross (study herehere or elsewhere) of the 50 & 200 SMA is on - these MA's are currently flat #D1.
      • The critical 5 EMA and 13 SMA on the EOW, poised to cross bearishly or deflect bullishly - below or above 8618, respectively #W1.
      Indicators:
      • Bulls would want the STS, moving back above the overbought line, to demonstrate their domination of the Medium and Long Term Screens #W2.


      Wrap :
      Bulls look to support on the 5 EMA and the '3 outside up' #M1 on the Monthly charts, to get back above the Wall
      Bears depend on the medium term Channel top resistance, and the 'Evening Doji Star', to stay below the Wall #W1.