 |
| Nifty 50 - End of Month (EOM) Chart - Channel analyzing Data from 2008 onward - as on 15 Feb'13 |
 |
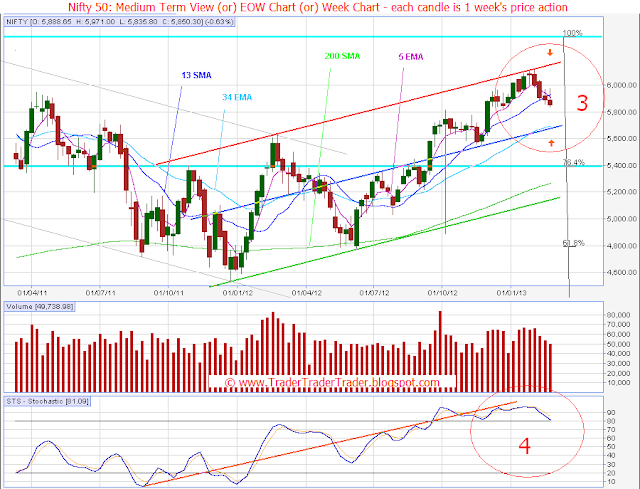
| Nifty 50 - End of Week (EOW) Chart - Channel analyzing Data from Mid 2011 onward - as on 15 Feb'13 |
 |
| Nifty 50 - End of Day (EOD) Chart - Channel analyzing Data from Nov' 2012, onward - as on 15 Feb'13 |
Learning from the Past Week: (click here for the post)
Channel Top Stop on the EOW #3, remains the nemesis of Bulls for yet another week.
2 crows pattern which we studied, gives the Bears #3 - more gains.
Day channel #5 (new) sees the Price taking support at the the channel bottom.
50 SMA and 200 SMA converge - on the EOD charts #5.
MACD Histogram shows positive divergence to price #6.
Bears get a bearish cross of the 13 SMA and 5 EMA on the Medium term screen #3.
Position of the STS in the oversold shows that the Bulls are around for a comeback #4.
Bulls take support on the 5 EMA on the EOM #1.
Our mark for the week 5969 was the top made by the Index last week, the bearish cross of the 5 EMA & 13 SMA on the EOW #3 results - Vigilant Bears get their honey..
Looking Forward into the next Week:
Channel top on the EOW, remains a major resistance #3.
Bouncing from the green bottom line of the new EOD channel #5 - Bulls could attempt a retake of the short term screen.
Index giving a bullish cross of the 5 EMA and the 13 SMA on the EOW #3, is critical for Bulls.
2 crows pattern that we studied last few weeks, to be followed up for its targets.
50 SMA and 200 SMA convergence towards a death cross to be watched #5.
Getting above the 76.4% Fibonacci retrace of the last low (Jan'12) from Nifty's all time high #1 - by month end (5919) - is important for Bulls to get a shot at new Highs.
Using the Bottom Channel line of the Day Channel #5, and the 5 EMA on the EOM #1, Bulls can look for a throwback towards the 50 SMA on the EOD #5.
